

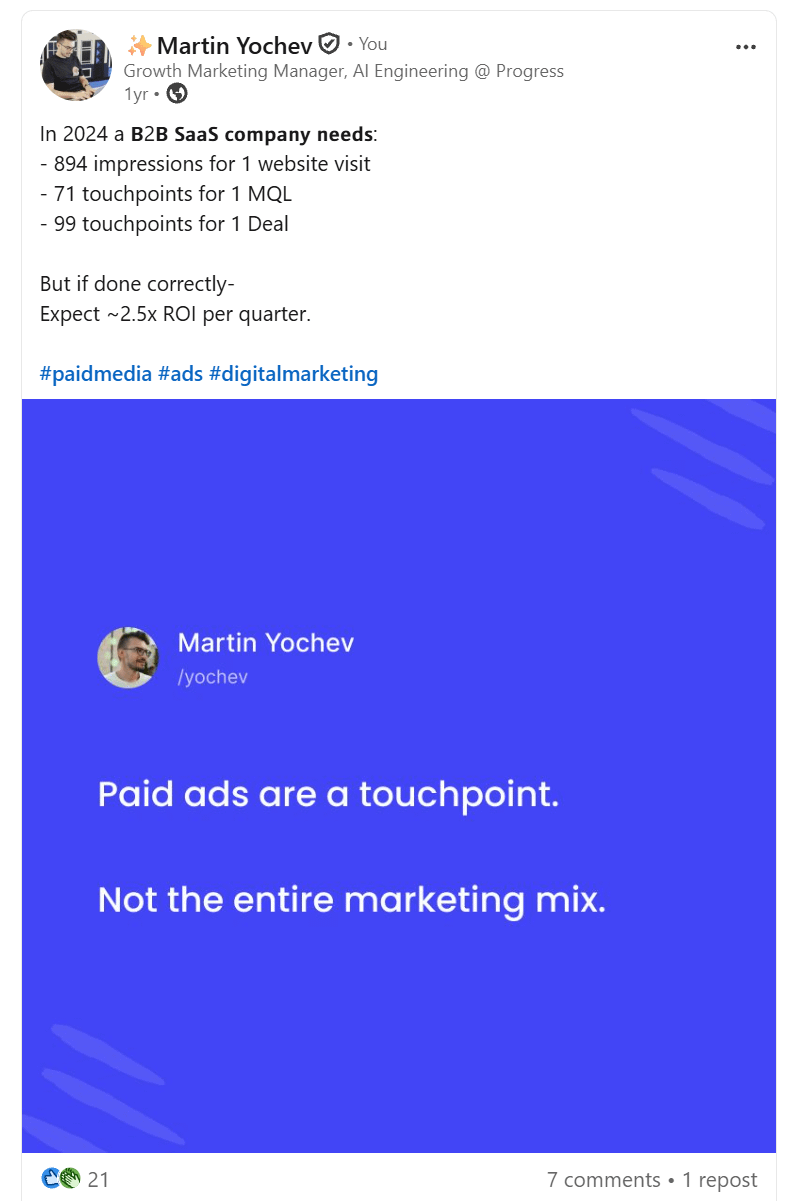
Back in 2024 I wrote a post that leaned hard on one stat from HockeyStack: a B2B SaaS company needed 894 impressions to earn a single website visit, 71 touchpoints to generate one MQL, and 99 touchpoints to close a deal.
I still catch myself citing those numbers in decks and calls. They’re good numbers, from a real study. They’re also two years old now, in a market where LinkedIn’s auction, Google’s results page, and buyer behavior have all shifted.
So I went looking for whoever re-ran HockeyStack’s study, or the closest thing to it, to see if the number went up and by how much. Nobody re-ran it exactly. But enough dated, credible research exists now to answer the real question underneath it: is it harder to close a B2B deal today than it was in 2024? Yes. of course. Case closed.
The thesis hasn’t changed. If anything it’s stronger: paid ads are a touchpoint. Not a strategy.
The short version
HockeyStack’s original numbers came from 150 B2B SaaS companies, January to August 2024. Nobody, including HockeyStack, has published a 2025 or 2026 refresh of that specific study. The closest real successor is Dreamdata’s 2026 LinkedIn Ads Benchmarks Report: buyers now touch 88 touchpoints across 4 channels with 10 stakeholders involved, up from 76, 3.7, and 6.8 just a year earlier, and 81% of the journey now happens entirely outside the sales pipeline, up from 70%. Forrester’s 2026 buying survey puts the average buying group at 22 people. Gartner has 67% of B2B buyers now saying they’d prefer a rep-free purchase, up from 61% eighteen months ago. 6sense’s 2025 data shows the research-to-seller split moving from 70/30 to 60/40. Google zero-click search sessions went from 60.45% to 68.01% between 2024 and 2026. None of this is a clean update to 894/71/99. All of it points the same direction: it got worse.
What HockeyStack’s study actually found In 2024
HockeyStack’s numbers come from HockeyStack Labs, authored by their CRO Emir Atli, drawn from 150 B2B SaaS companies with at least $15K a month in ad spend, measured January through August 2024:
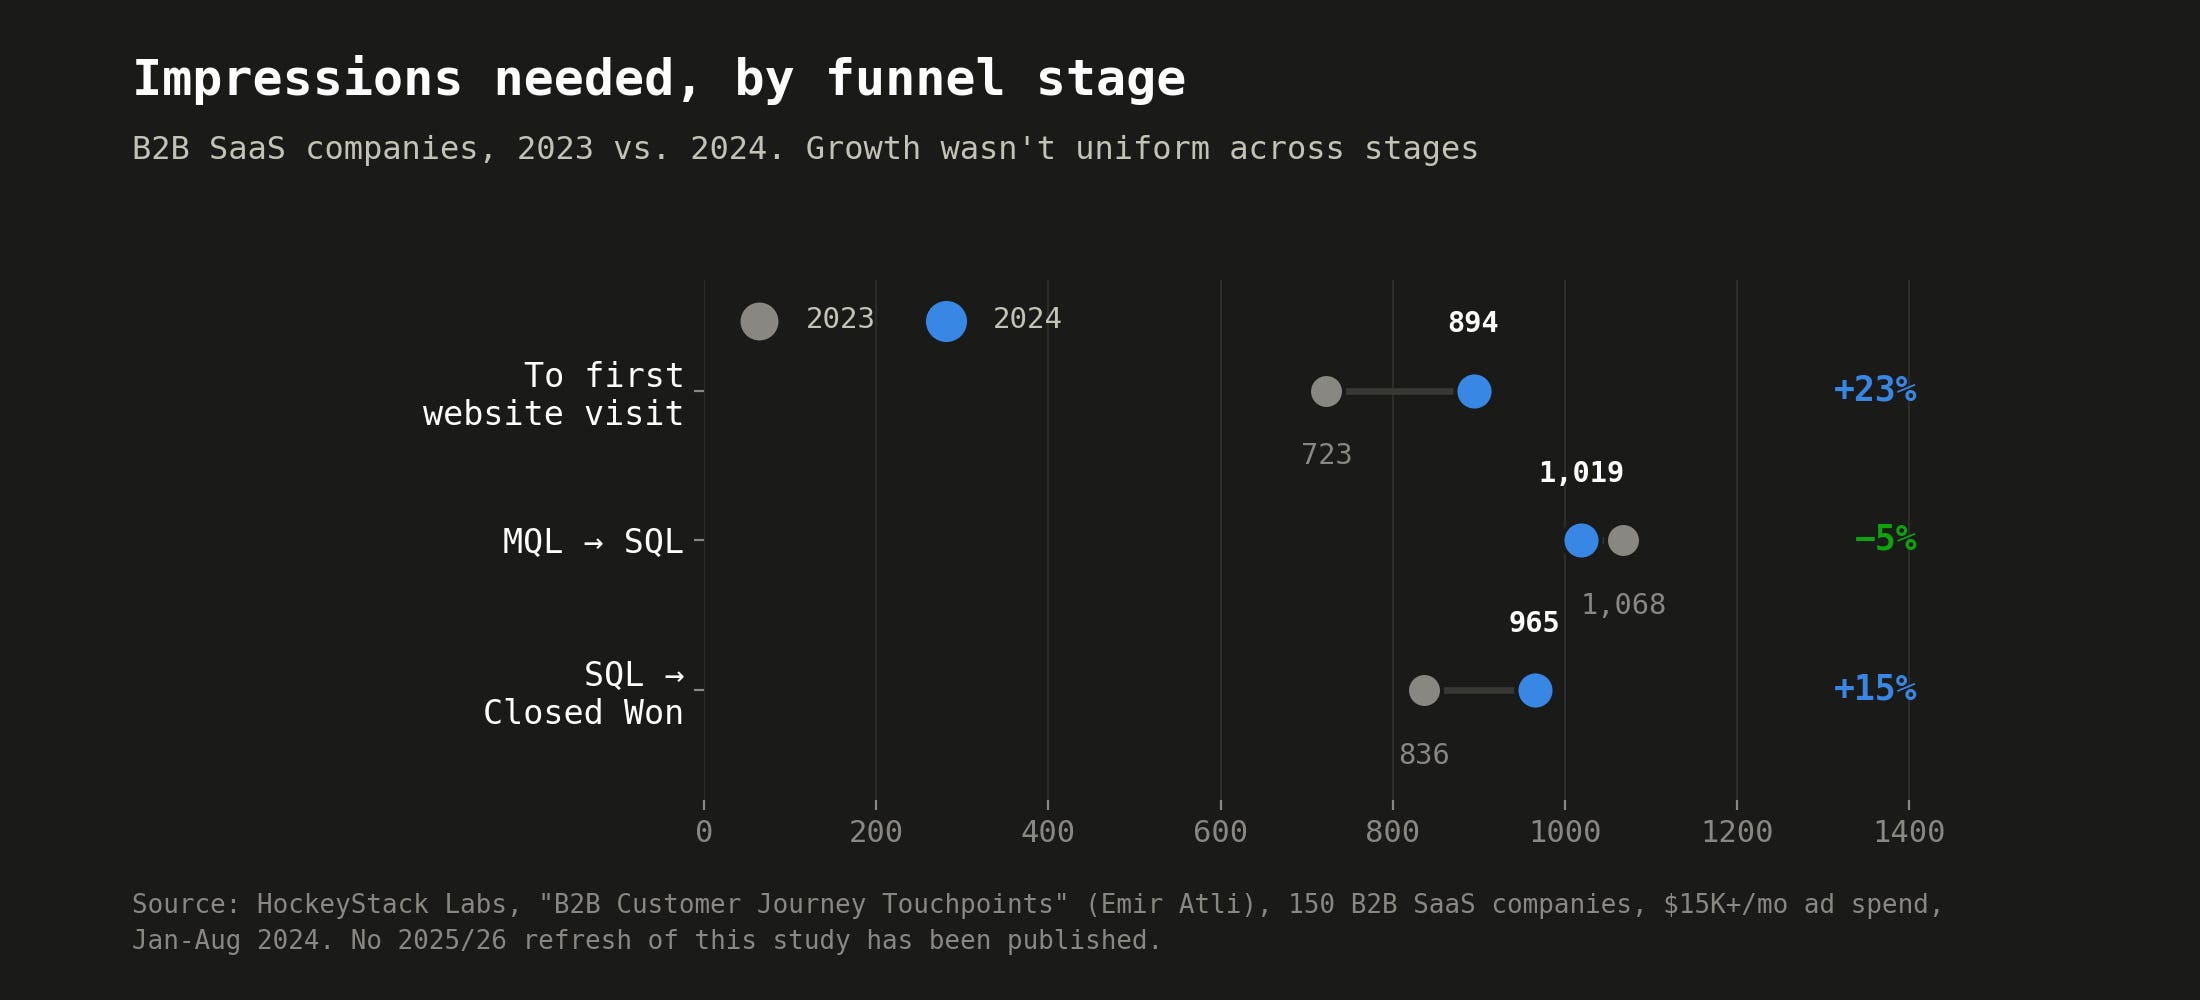
894 impressions to earn a first website visit, up 23% from 723 in 2023
71 touchpoints to generate one MQL, up 31% from 54
99 touchpoints for the SQL-to-Closed-Won stretch, up 22% from 81
Two corrections to how I originally framed this. First, 894 is specifically LinkedIn company-level ad impressions, not a blended number across your whole paid media mix. If you read it as impressions across Google, Meta, and LinkedIn combined, that’s not what HockeyStack measured (I hadn’t clocked this either until I went back and checked their methodology). Second, “99 touchpoints for a deal” is really just the last leg, SQL to Closed Won, not the whole journey. First touch to closed deal was 266 touchpoints and 2,879 impressions in 2024, up 19.8% and 9.5% over 2023. Growth wasn’t even across stages, either: impressions dropped 5% in the MQL-to-SQL stage while touchpoints rose in every stage.
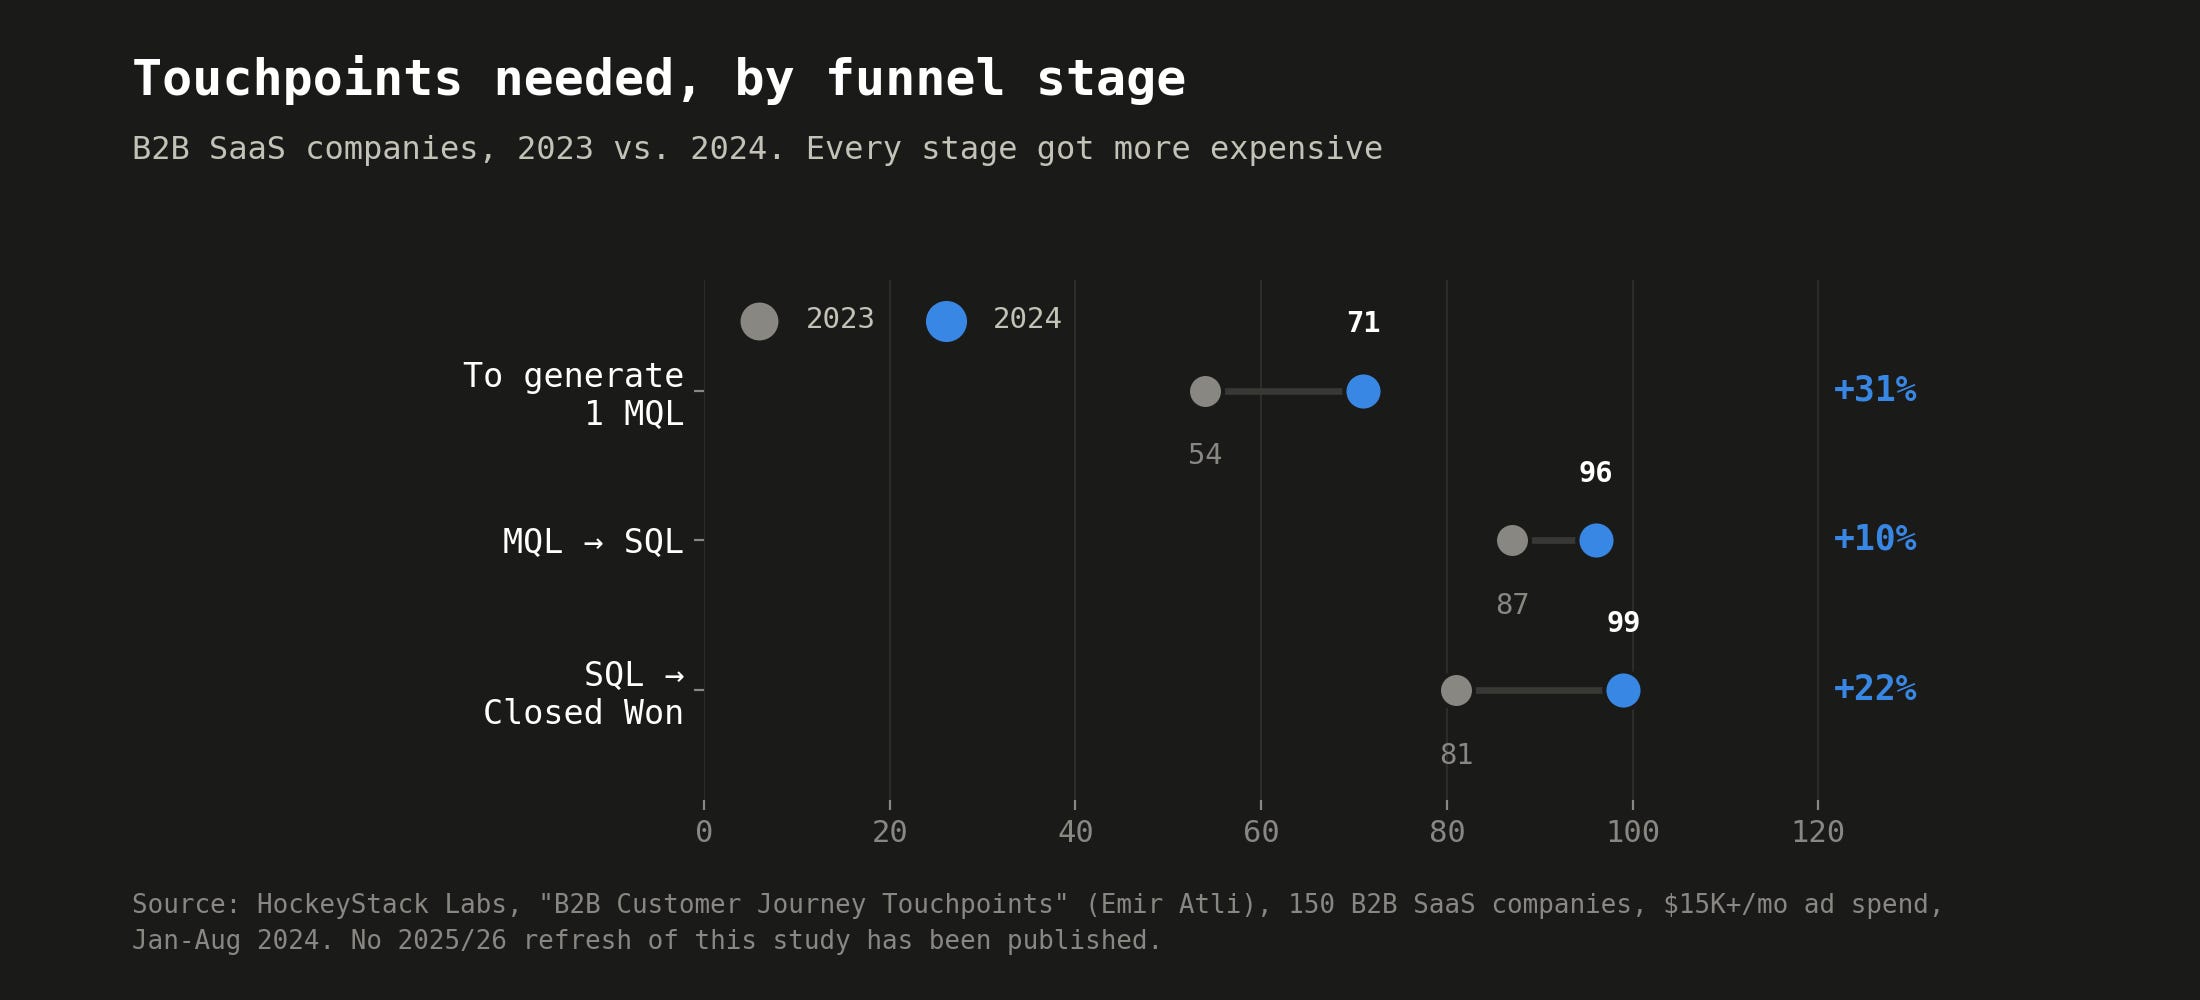
Deal size moves these averages more than anything else does. Sub-$10K ACV deals needed 40% fewer impressions and 31% fewer touchpoints than average just to hit MQL. Deals over $100K ACV needed roughly 5,500 impressions and 417 touchpoints to close, with the SQL-to-Closed-Won stretch alone eating 2,081 impressions. If you sell enterprise, every average in this post is underselling your real funnel math.
There’s no clean 2026 update
HockeyStack did publish a separate, current 2025 LinkedIn Ads Benchmark Report (70+ companies, $28M in ad spend analyzed), which found aggregate LinkedIn CTR improving over the course of the year, from about 0.82% in Q1 to 0.96 to 1.05% by Q3. That’s a real, current data point. It’s just a different metric than impressions per company, and it doesn’t update 894.
So instead of inventing a 2026 number to make a cleaner headline, here’s the closest real evidence I found.
The closest real evidence
The best successor stat comes from Dreamdata’s 2026 LinkedIn Ads Benchmarks Report (Anna Thorsen, published March 10, 2026), built on 66 million-plus sessions and 3.5 million-plus customer journeys:
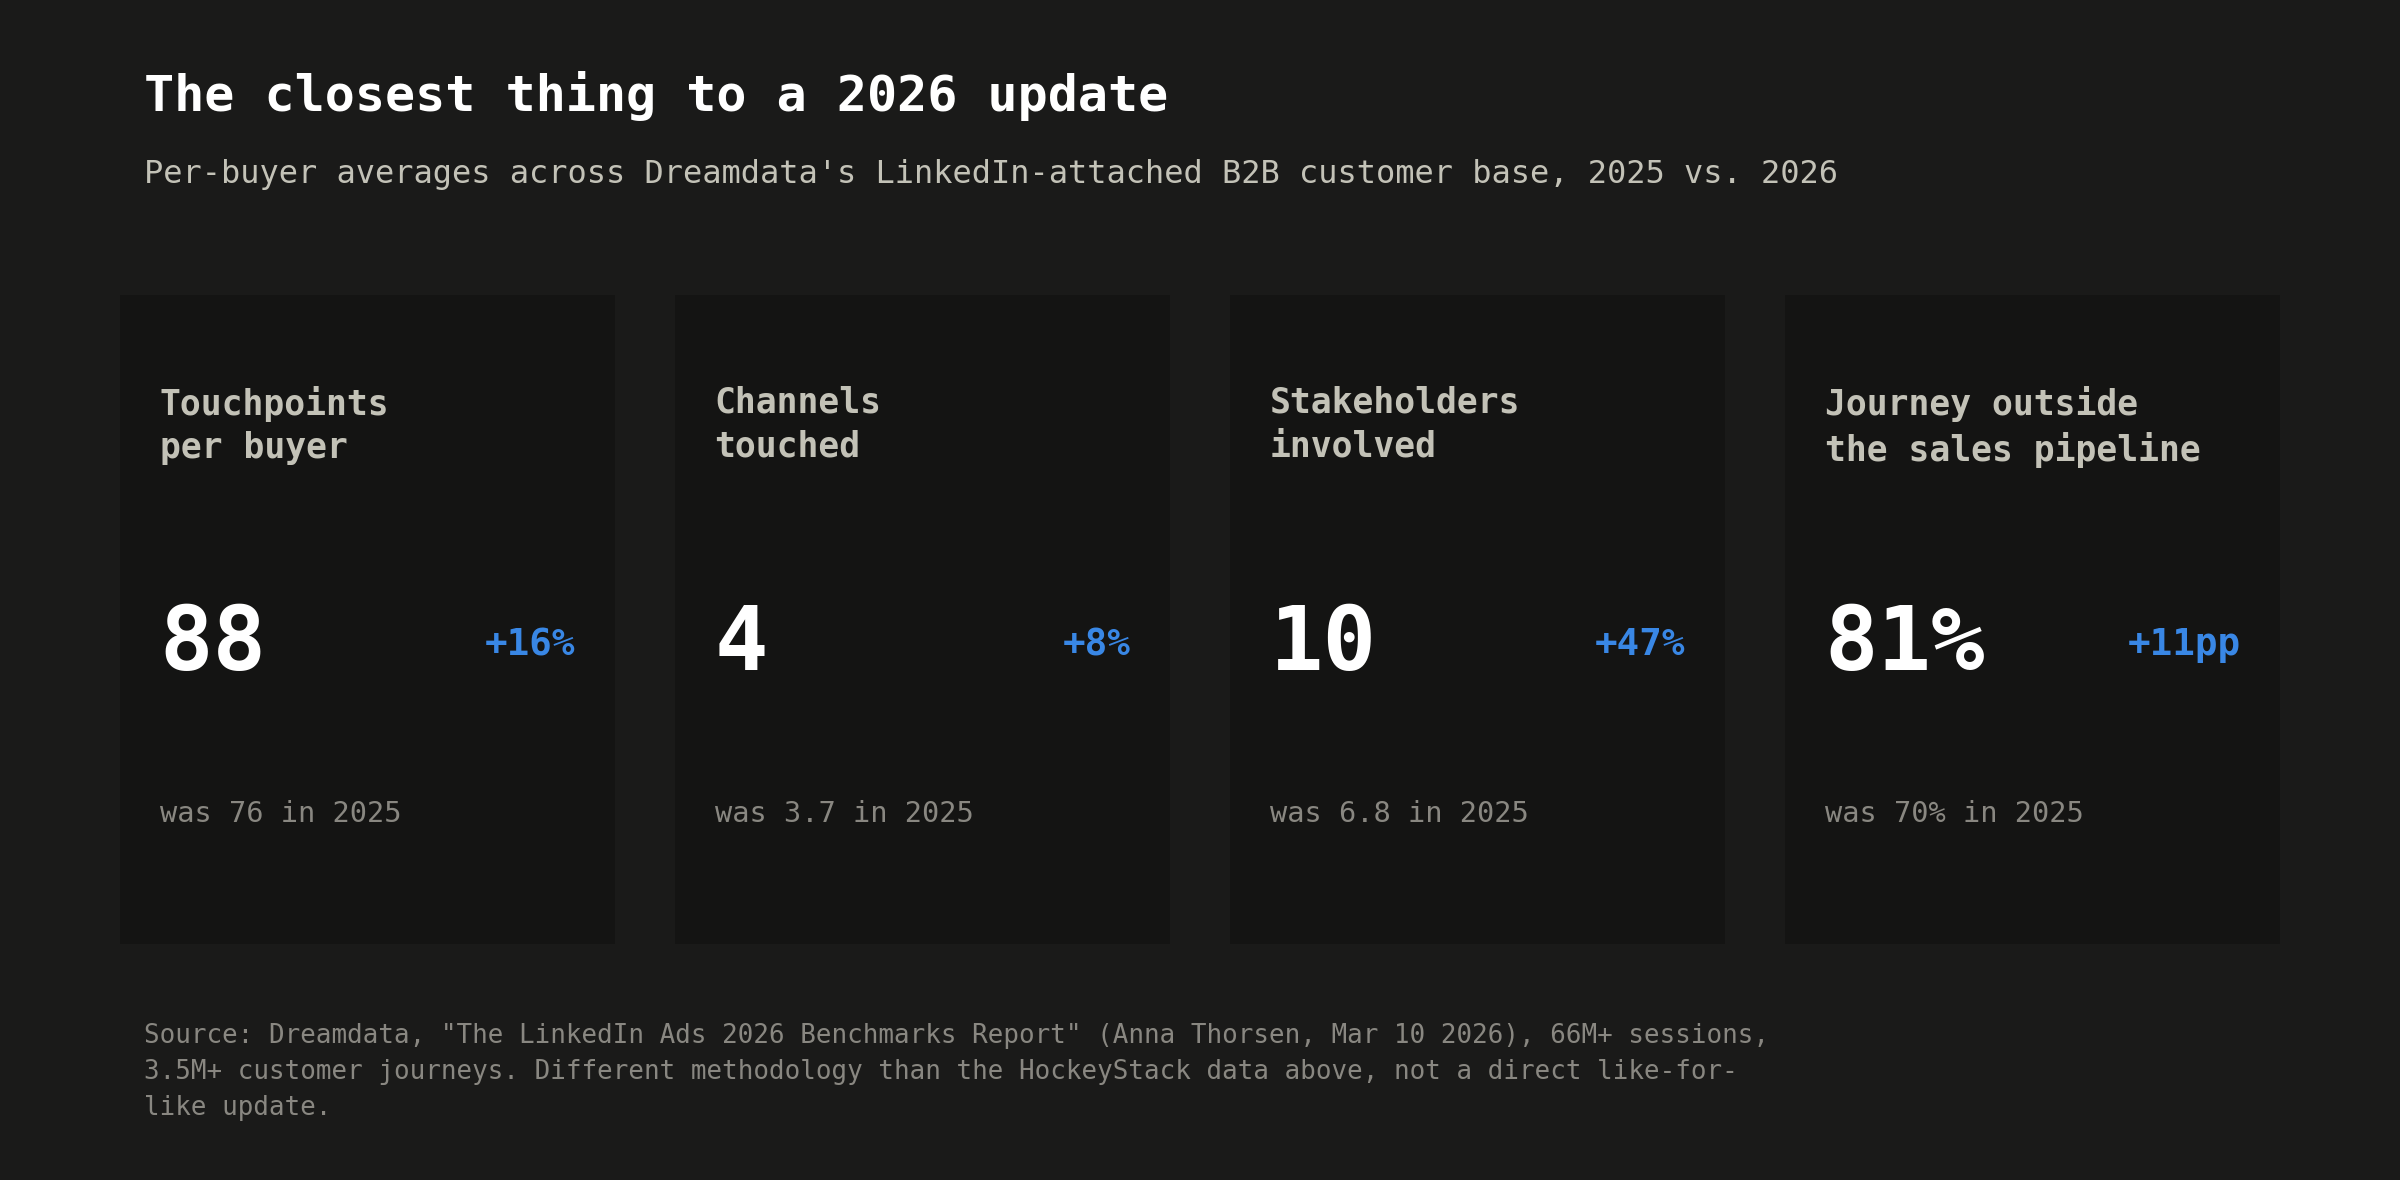
What it shares with HockeyStack’s data is the direction: buying in 2026 takes more touches, across more channels, with more people involved, than it did a year earlier. A 16% jump in touchpoints and a 47% jump in stakeholders in a single year isn’t noise.
The buying group got bigger, full stop
This part is the most solidly documented, because three research groups landed on the same conclusion using three different methods.
Forrester’s “State of Business Buying, 2026” (published January 21, 2026) puts the typical buying decision at 13 internal stakeholders and 9 external influencers, 22 people touching a single purchase, with 73% of purchases involving three or more departments. That’s well past the “6 to 10 people” figure Gartner made famous for most of the last decade. Gartner’s own newer research backs the shift: a May 2025 survey found buying groups now ranging from 5 to 16 people across up to 4 functions, and that 74% of those groups show “unhealthy conflict” during the decision process. More people in the room, more people disagreeing in the room. Selling to a committee that argues with itself internally is exactly as fun as it sounds.
That lines up with Dreamdata’s jump from 6.8 to 10 stakeholders above. Three studies, three data sources, one direction: the buying committee isn’t shrinking.
Buyers are moving faster without you
6sense’s 2025 B2B Buyer Experience Report (4,000+ buyers across North America, EMEA, and APAC) found the split between independent research and seller engagement moved from 70/30 to 60/40 in a single year. Buyers are spending relatively more time with reps, not less, which cuts against the popular “dark funnel” story in one specific way. But the same report found 94% of buying groups had already ranked a preferred vendor before first contact with sales, and bought that vendor 77% of the time. The buying cycle also compressed, from about 11 months in 2024 to 10 in 2025.
Put those together: buyers loop sales in a bit earlier than before, but only after they’ve already picked a favorite. Gartner is tracking the same shift in stated preference: 61% of buyers said they’d prefer a rep-free purchase in mid-2025, and that was already 67% by March 2026, a 6-point jump in under a year on a preference that was already a majority.
AI adds a verification step. It doesn’t remove one
The obvious question in 2026 is whether AI is shortening this process. From what’s published so far: not really. It’s changing what buyers do with the extra time, not cutting the steps.
TrustRadius’s 2026 B2B Buying Disconnect Report (1,862 buyers, 444 vendors, published July 2026) found 63% of buyers now use AI somewhere in the purchase process, and 54% say it made research easier, up from 40% a year earlier. But 94% fact-check whatever the AI told them, and the average shortlist a buyer considers is just 2.7 products, tighter, not looser, even as the buying committee grows. Gartner’s May 2026 survey found the same pattern from the other side: 45% of buyers used GenAI during a recent purchase, mostly to research vendors, buyers consult an average of 7 information sources, and 69% say they’d still rather validate AI-generated insights with a sales rep than trust the AI alone. Which, if you’ve ever watched someone paste a vendor comparison into ChatGPT and then call the rep to double-check it anyway, tracks.
If you’re optimizing for “get on the shortlist,” 2.7 products is the single most useful number in this piece. You’re not competing against ten vendors for attention. You’re competing to be one of three names a buyer already trusts before they start looking seriously, which pushes the whole game earlier, into that 81%-outside-the-pipeline territory Dreamdata is measuring.
Why impressions probably cost more now
The underlying math has gotten worse, mostly upstream of any single ad platform.
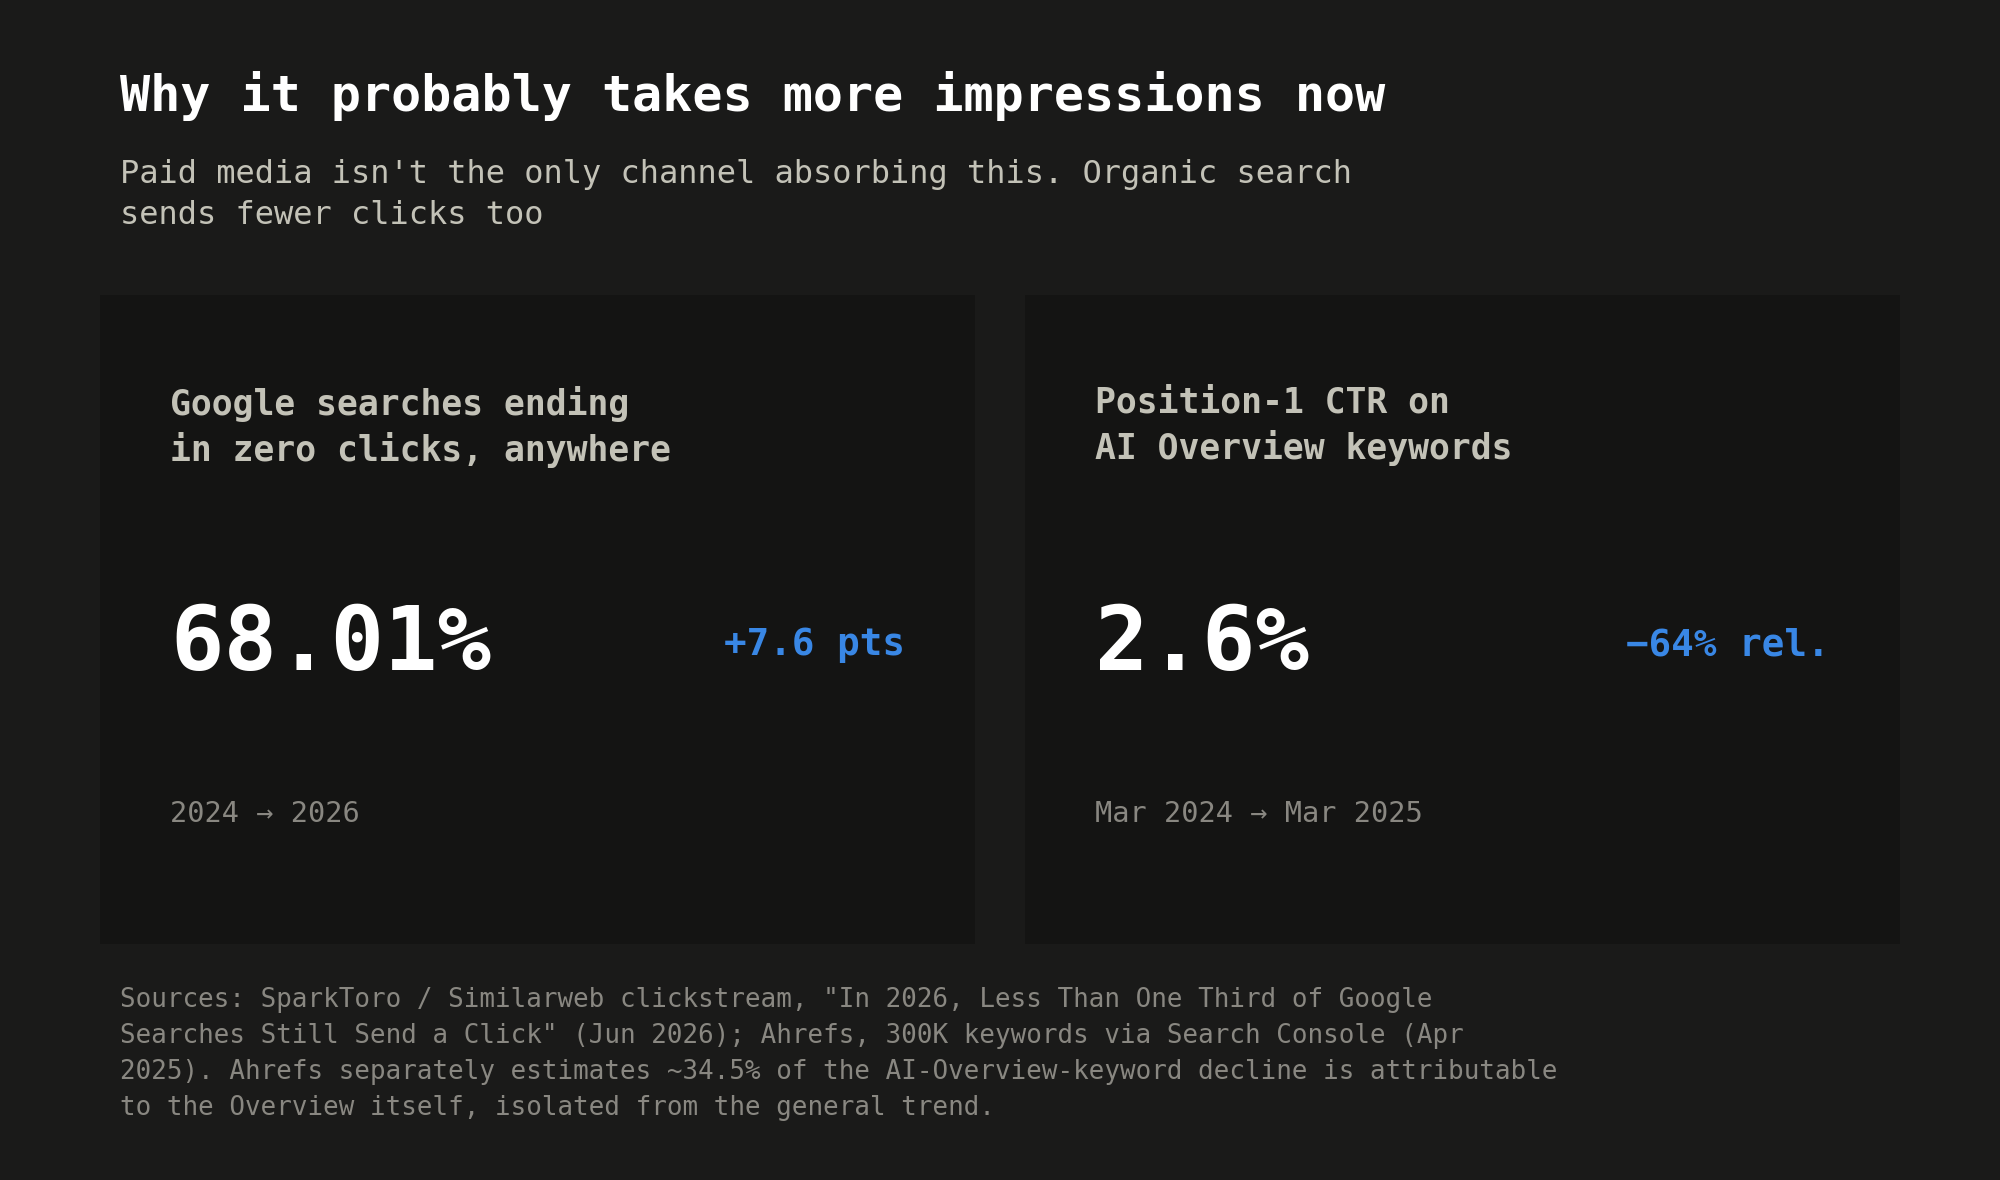
SparkToro’s analysis of Similarweb clickstream data (Rand Fishkin, published June 2026) found 68.01% of US Google searches in the first four months of 2026 ended without a click anywhere, up from 60.45% in 2024, by their count the fastest acceleration in zero-click search in the past decade. Ahrefs analyzed 300,000 keywords via Search Console and found position-1 organic CTR on keywords that trigger an AI Overview fell from 7.3% to 2.6% between March 2024 and March 2025, a 64% relative drop. Ahrefs attributes roughly 34.5% of that decline specifically to the AI Overview’s presence, separate from the general downward trend that hit even non-AI-Overview keywords over the same period (5.6% down to 3.1%).
WordStream’s 2026 benchmarks put programmatic display CTR at 0.12 to 0.40% depending on category, meaning 250 to 800-plus impressions per click is the baseline cost of that channel before any of this year’s headwinds. Display was always the volume play. It’s a bigger one now.
What this changes about your budget
The closest adjacent methodology’s most recent jump, Dreamdata, 2025 to 2026, is 16% on touchpoints and 47% on stakeholders. Different studies measuring different things, about a year apart. Line them up and the pattern holds: whoever measures this next will very likely report a bigger number than 2024’s, probably somewhere in the 15 to 30% range both studies found independently.
If you run paid media for a B2B SaaS company, three things here should change what you do this quarter.
With 81% of the journey now happening outside any pipeline you can track, and the average buyer touching four-plus channels before converting, a media plan concentrated in one platform structurally can’t cover the journey. It never really did. The gap is just 11 points wider than it was a year ago.
The shortlist number matters more than the funnel number. A 2.7-product average shortlist means the job isn’t filling a funnel with strangers, it’s being one of three names already in a buyer’s head before they open a tab. That’s a brand problem as much as a demand-gen one, and it won’t show up in a last-touch attribution report.
Budget for more impressions per outcome, not fewer. Bigger buying groups, more channels, lower organic CTR: all of it points toward funnel math getting harder. If your 2026 plan assumes the same impressions-to-pipeline ratio you used in 2024, it’s probably underfunded.
Frequently asked questions
Is AI shrinking the B2B buyer journey? Not based on anything published so far. It’s changing what buyers do with their research time, not cutting steps. 63% now use AI somewhere in the process, but 94% fact-check it and 69% would still rather validate with a sales rep.
Did the buying group get bigger, or is that just one report? Three independent sources agree. Forrester puts it at 22 people, Gartner’s 2025 survey found groups of 5 to 16 across up to 4 functions, and Dreamdata’s data shows stakeholders per deal rising from 6.8 to 10 in a year.
How many touchpoints does it actually take to close a B2B deal in 2026?
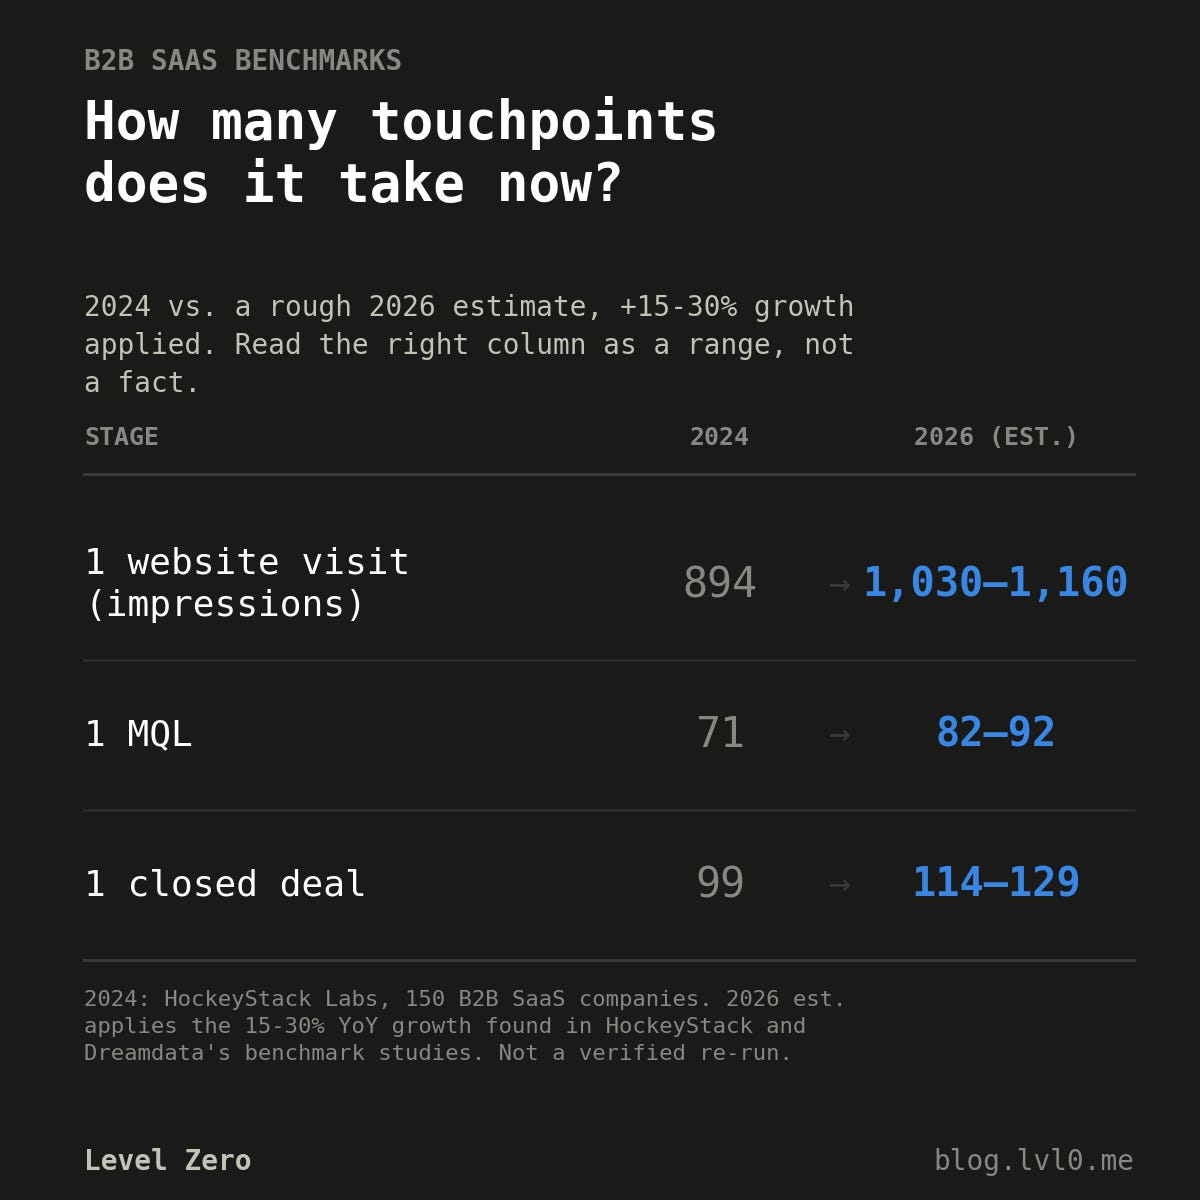
There's no single verified number, that's the whole point of this piece. The closest real data point is Dreamdata's: 88 touchpoints per buyer on average, up from 76 a year earlier. Apply the 15 to 30% growth pattern found across every 2025/26 study to HockeyStack's original 2024 numbers and you land somewhere around 82 to 92 touchpoints for an MQL and 114 to 129 for a closed deal. Plan around a range, not a single figure.